


Backblaze’s Releases Hard Drive Statistics For Q2 2020 – The Lowest Annualized Failure Rate Since 2013
Backblaze’s Releases Hard Drive Statistics For Q2 2020 – The Lowest Annualized Failure Rate Since 2013
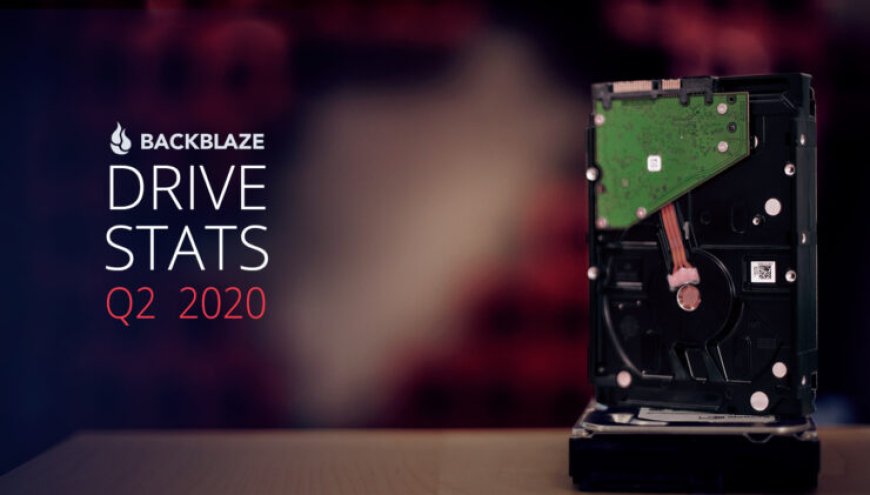
As of June 30, 2020, Backblaze had 142,630 spinning hard drives in their cloud storage ecosystem spread across four data centers. Of that number, there were 2,271 boot drives and 140,059 data drives. This review looks at the Q2 2020 and lifetime hard drive failure rates of the data drive models currently in operation in their data centers and provides a handful of insights and observations along the way.
At the end of Q2 2020, Backblaze was using 140,059 hard drives to store customer data. For their evaluation, they remove from consideration those drive models for which we did not have at least 60 drives (see why below). This leaves us with 139,867 hard drives in their review. The Annualized Failure Rate (AFR) for Q2 2020 was 0.81% versus Q1 2020 which was 1.07%. The Q2 AFR number is the lowest AFR for any quarter since it started keeping track in 2013. In addition, this is the first time the quarterly AFR has been under 1%. One year ago (Q2 2019), the quarterly AFR was 1.8%.
During this quarter, three HDD models had 0 (zero) HDD failures: the Toshiba 4TB (model: MD04ABA400V), the Seagate 6TB (model: ST6000DX000) and the HGST 8TB (model: HUH728080ALE600). While the Toshiba 4TB HDDs recorded less than 10,000 drive days, they have not had an HDD failure for that model since Q4 2018, or 54,054 drive days. In comparing HDD days with the Toshiba HDDs, the Seagate 6TB and HGST 8TB drives are just as impressive, having no failures in the quarter yet recording 80,626 and 91,000 drive days respectively in Q2 2020.
There were 192 HDDs that were not included in the list above because they did not have at least 60 drives of a given model. For example, they have 20 Toshiba 16TB drives (model: MG08ACA16TA) they are putting through Backblaze's certification process. On the other end of the spectrum, they still have 25 HGST 4TB drives (model: HDS5C4040ALE630), putting in time in Storage Pods. Observant readers might note the model number of those HGST drives and realize they were the last of the drives produced with Hitachi model numbers.
They deployed 12,063 new HDDs and removed 1,960 drives via replacements and migration in Q2, giving us a net of 10,103 added drives. Below is a table of the drive models they deployed.
Quarterly data is just that, data for only that quarter. At the beginning of each quarter they wipe out all the previous data and they start compiling new information. At the end of the quarter, they bundle that data up into a unit (collection, bag, file, whatever), and name it; Q2 2020, for example. This is the type of data you were looking at when you reviewed the Quarterly Chart for Q2 2020 shown earlier in this report. They can also compare the results for a given quarter to other quarters, each their own unique bundle of data. This type of comparison can reveal trends that can help us identify something that needs further attention.
One chart above shows the AFR by a manufacturer using quarterly data over the last three years. Following the chart is two tables. The first is the data used to create the chart. The second is the count of the number of hard drives corresponding to each quarter for each manufacturer.
What's Your Reaction?